This is an automated archive made by the Lemmit Bot.
The original was posted on /r/dataisbeautiful by /u/adamtwelve20 on 2024-11-17 16:11:06+00:00.
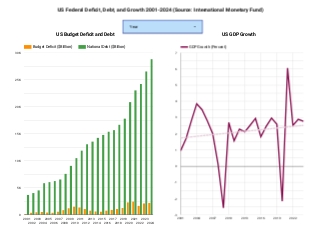
This chart shows the trend in budget deficit, debt, and GDP growth in the US since 2001. It shows business cycles and shocks (9/11, Great Recsssion, COVID) and uses non-political colors.
Source is the International Mometary Fund World Economic Outlook Database
You must log in or register to comment.


